Dynamis Solutions
ENFR
Book a call
ConsultingPower BIFabricAI — Applications & Agents
Power BI Consulting

Power BI Reporting Your Teams Use Every Day

We build and optimise Power BI models and reports, prepare them for Copilot, and train your people to run them.

Get in Touch See Use Cases

The Starting Point

From Excel Reporting to One Governed Model

Most teams come to us with the left column. They leave with the right one.

Today

  • KPIs rebuilt by hand in Excel before every review
  • Several versions of the same number
  • Reports that take too long to load
  • No comparison against target or previous year
  • Knowledge held by one person

With Dynamis

  • One semantic model feeding every report
  • KPI definitions agreed once and written in DAX
  • Pages that load in seconds
  • Every KPI shown against target and previous year
  • A documented environment your team can run

What We Deliver

Model, Design, Governance & Handover in One Engagement

Semantic Model & DAX

Build one star-schema model and write each KPI once, so every report returns the same number under every filter.

Get in Touch

What You Get

  • Star schema designed around your business entities
  • Time intelligence on your fiscal calendar
  • Field parameters to switch metric and unit on one page
  • Performance tuning for fast page loads
fctSales
Order lines · quantity · value
dimDate
Fiscal week
dimCustomer
Channel · country
dimProduct
Brand · category
dimSite
Site · region

One fact table, dimensions around it, one-directional relationships. Measures written once return the same result in every report.
Report Design & UX

Design pages that answer one business question each, with every KPI shown against target and previous year.

Get in Touch

What You Get

  • One design system across all reports
  • KPI cards with variance against target and previous year
  • Custom visuals when native charts fall short
  • Navigation and cross-filtering that behave consistently
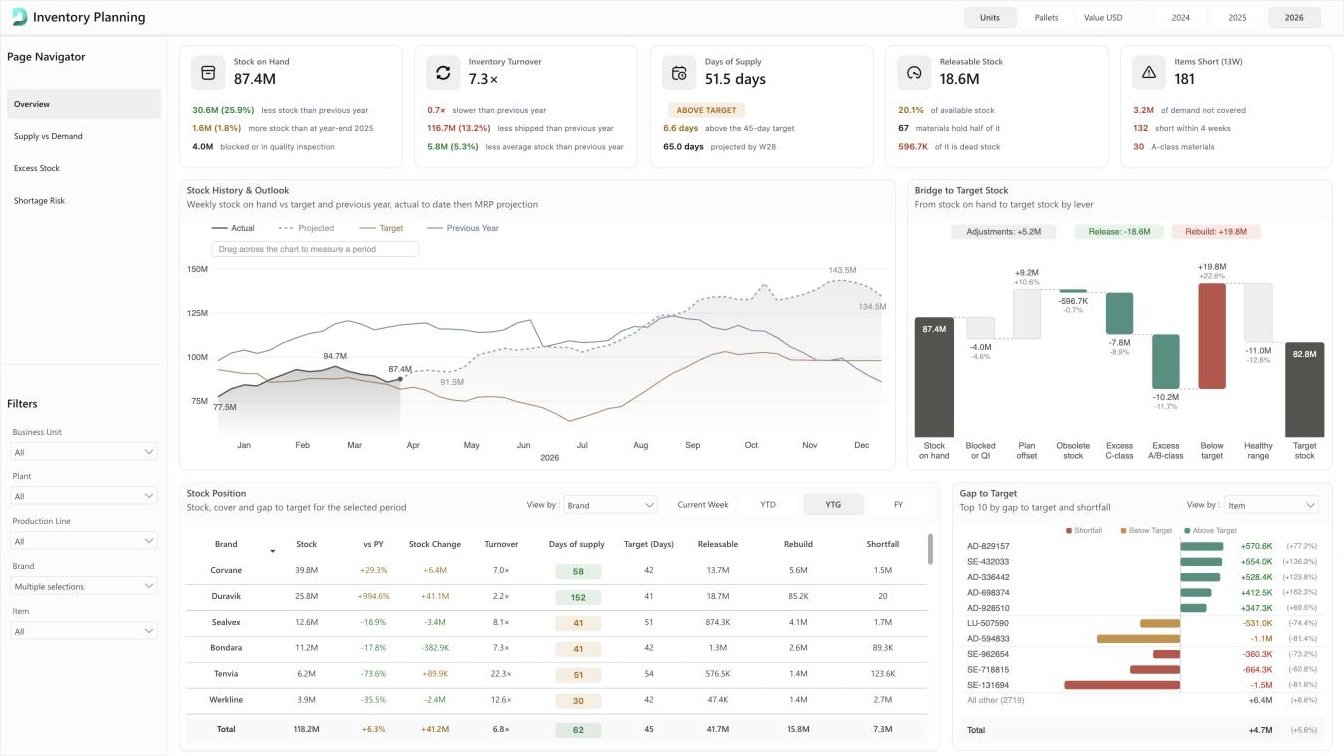
Inventory Planning — Overview
Inventory Planning report: stock on hand, turnover, days of supply, stock history and bridge to target stock
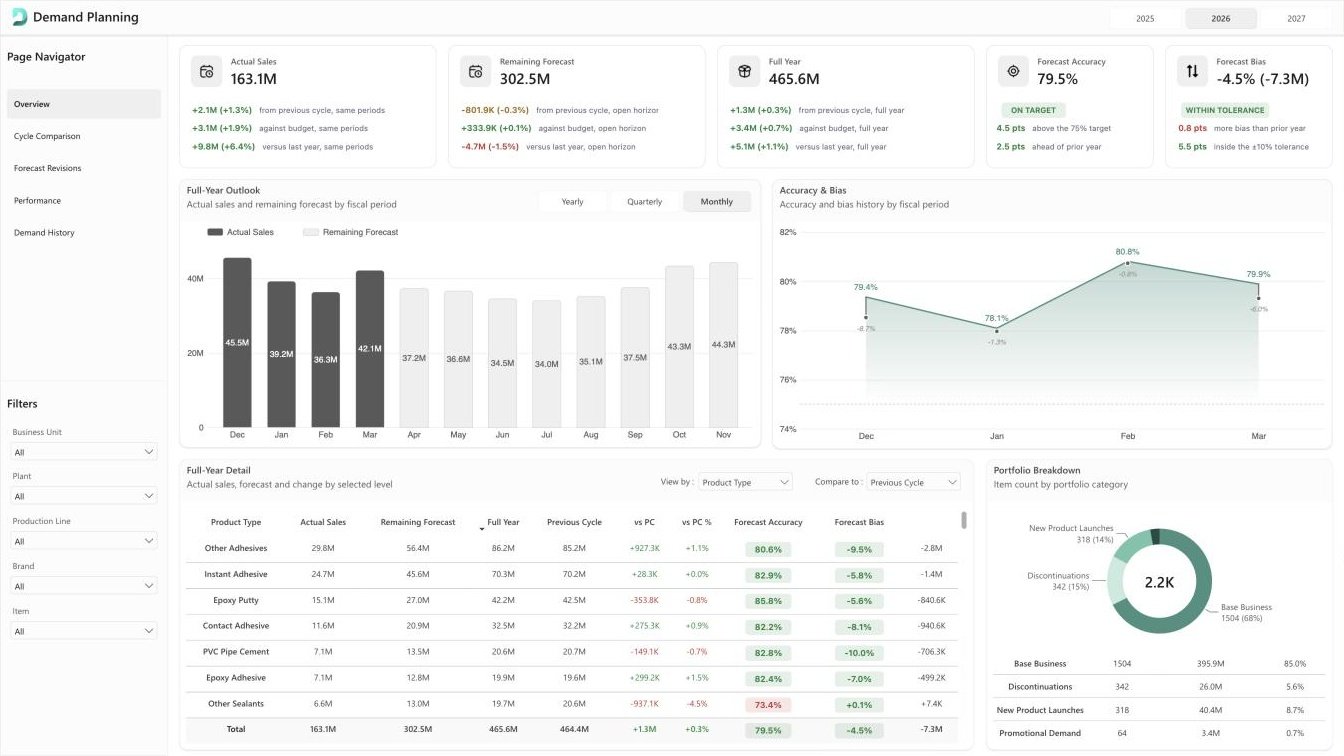
Demand Planning — Overview
Demand Planning report: actual sales, remaining forecast, forecast accuracy and bias
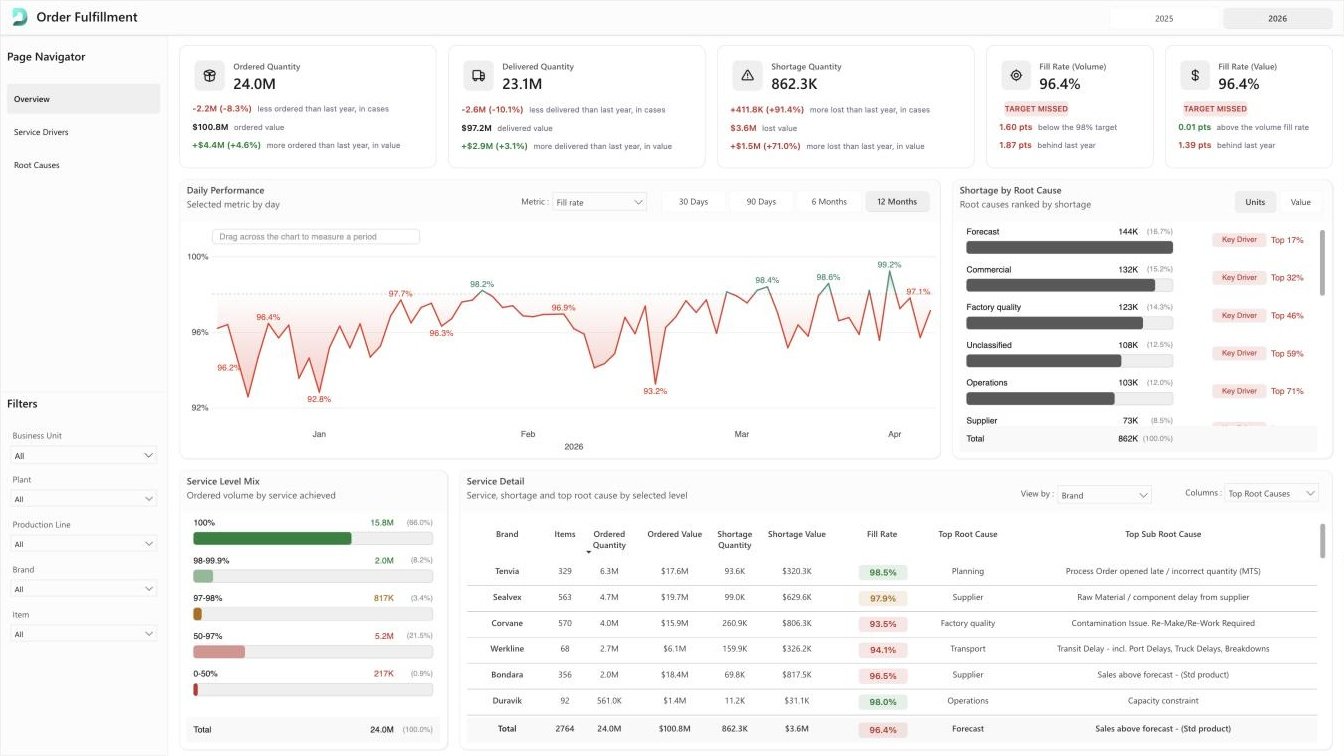
Order Fulfillment — Overview
Order Fulfillment report: fill rate, shortage by root cause and service detail

Access & Governance

Decide who sees what once, in the model, and ship changes through a controlled release path.

Get in Touch

What You Get

  • Row-level security by market, site or function
  • Workspace structure and release process
  • One Power BI App as the single entry point
  • Naming and documentation standards
Manager · Germany
RLS · Region = DE
Sees DE only
Manager · France
RLS · Region = FR
Sees FR only
Managing Director
RLS · No filter
Sees all regions

Row-level security is applied once in the model. One dataset and one set of measures serve every market.

Handover & Training

Leave your team with an environment they understand and can extend.

Get in Touch

What You Get

  • Model and measure documentation
  • Training for developers and business users
  • Recorded walkthroughs of every report
  • Optional support after delivery
Handover pack
[SCREENSHOT — MODEL DOCUMENTATION]Add one page of the documentation you hand over: the measure list with descriptions or the model diagram.

Get Started

Easy Launch, Smart Insight, Quick Results

Three stages, from connecting your data to an environment that grows with you.

01

Seamless Integration

Connect to the enterprise tools you already use, with minimal IT involvement and a first release in weeks.

Existing ToolsMinimal IT InvolvementDeployment in Weeks
02

Rapid Configuration

Put the BI infrastructure in place: connected reports, a scalable model and delivery through one secure Power BI App.

Connected ReportsScalable ModelSecure Power BI App
03

Built to Evolve

Add users, data and markets as priorities change, without redesigning the foundation.

New Users & DataNo RedesignArchitecture for Growth

Ready for Reports Your Teams Use Every Day?

Book an intro call. We review your current reporting, scope the work and send a written proposal.

Book an Intro Call

FAQs

Answers to what teams ask before starting a Power BI project.

Can you work inside our Power BI tenant?

Yes. All work happens in your tenant, under your security model. No data leaves your environment.

Which data sources can you connect?

ERP systems, data warehouses, planning tools and files. We agree the connection pattern with your data team.

We already have reports. Do you start again?

No. If the model is sound, we improve design and performance on top of it. If it is not, we rebuild the model and keep your reports.

How long before the first report is live?

The first release usually ships within weeks. You receive a timeline with the written proposal.

Who maintains the environment after delivery?

Your team, with the documentation and training included in the project. Ongoing support is optional.